How to choose the stocks
I’ve always believed that there’s no easier or more straightforward way to grow your wealth than through stock investing.
The reason is simple: once you select and purchase stocks based on predetermined criteria, you can essentially leave them alone, and your assets will grow whether the share price goes up or down.
That said, for those who are just starting out, choosing stocks is often the first major hurdle.
So, in this article, I’d like to introduce a step-by-step approach to stock selection that I recommend for beginners.
Of course, the following process isn’t necessarily the best or only method—think of it more as a starting framework that you can adapt to your own preferences, refine through trial and error, and revise as needed.
Although you should investigate many things, the publication Quarterly or YAHOO Japan Finance covers almost all the following items.
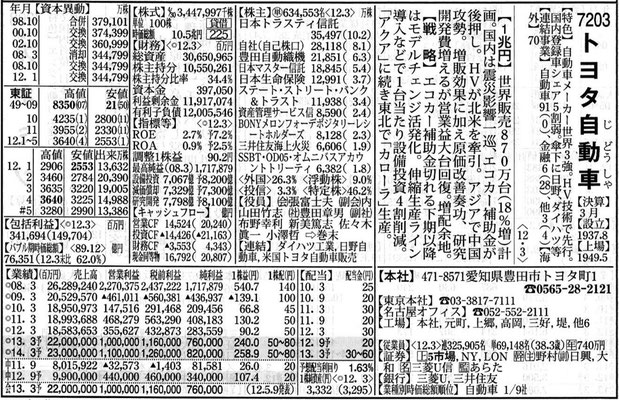
Quarterly is an information book of listed companies that mention financial information such as equity ratio, sales and previous records of profit.
Reference materials

Quarterly is accessible at Japanese bookstores or libraries.
YAHOO Finance (To search input the 4 digit enterprise code)
1 Select a high dividend yield stock.
Dividends are distributed from a company’s profits. They vary from year to year.
Please look over the dividend of past records, dividend payout ratio, and dividend policy and choose the stock which has less risk of cancel payments.
Dividend payout
ratio is the ratio of what percentage of profits were turned to dividends
If the payout ratio is too high, dividends may not be maintained when future profits decrease.
Dividend payout ratio = (dividend per share ÷ earnings per share) × 100%
The ideal is less than 50%
Major high dividend yield stocks
|
Code no |
Company name |
Stock Price |
Dividend yield |
PER |
PBR |
EX mouth |
|
1928 |
1,821 |
4.45% |
9.02 |
1.06 |
Jan |
|
|
2651 |
6,230 |
4.09% |
22.26 |
2.24 |
Feb |
|
|
2914 |
2,794 |
5.51% |
13.53 |
1.90 |
Dec |
|
|
3513 |
1,387 |
4.33% |
12.93 |
0.36 |
Mar |
|
|
5108 |
4,315 |
3.71% |
10.81 |
1.36 |
Dec |
|
|
6210 |
579 |
4.32% |
7.74 |
0.67 |
Mar |
|
|
6384 |
1,359 |
4.42% |
15.39 |
0.97 |
Mar |
|
|
6540 |
965 |
4.66% |
9.51 |
0.98 |
Dec |
|
|
6592 |
3,895 |
3.47% |
17.67 |
1.07 |
Dec |
|
|
6724 |
1,682 |
3.69% |
11.85 |
1.11 |
Mar |
|
|
6915 |
2,085 |
4.56% |
12.07 |
0.77 |
Dec |
|
|
7201 |
951 |
5.99% |
9.08 |
0.70 |
Mar |
|
|
7203 |
6,721 |
3.27% |
10.36 |
1.00 |
Mar |
|
|
7270 |
2,712 |
5.31% |
14.85 |
1.32 |
Mar |
|
|
7480 |
1,782 |
6.67% |
20.65 |
1.51 |
Mar |
|
|
7551 |
623 |
4.49% |
8.92 |
0.78 |
Mar |
|
|
7637 |
1,673 |
4.60% |
12.57 |
1.14 |
Mar |
|
|
7751 |
3,213 |
4.98% |
14.46 |
1.23 |
Dec |
|
|
8031 |
1,808 |
4.43% |
7.14 |
0.75 |
Mar |
|
|
8035 |
15,700 |
4.61% |
10.87 |
3.16 |
Mar |
|
|
8053 |
1,606 |
4.67% |
6.27 |
0.75 |
Mar |
|
|
8058 |
3,222 |
3.88% |
7.99 |
0.92 |
Mar |
|
|
8304 |
3,130 |
5.88% |
8.49 |
0.87 |
Mar |
|
|
8316 |
4,042 |
4.21% |
8.07 |
0.54 |
Mar |
|
|
8411 |
176 |
4.27% |
55.71 |
0.50 |
Mar |
|
|
9437 |
2,479 |
4.44% |
13.30 |
1.68 |
Mar |
Note: You should be responsible for your own investments. Please make your own final judgment.
2 Confirm if the share price is relatively low
PER and PBR are typical standards for judging a stock.
PER (Price Earnings Ratio)
Evaluation index of the company profit value.
PER is the figure you get when you divide the total current share price by the net profit.
PER = (total current share price)÷(net profit)
The share price is more value the lower the magnification.
PBR (Price Book-value Ratio)
Evaluation index of the corporate assets value.
PBR is the figure you get when you divide the total current share price by the net asset.
PBR = (total current share price) ÷ (net asset)
The share price is more valuable the lower the magnification.
If PBR is less than 1.0 that means investors estimate the company is worth less than its liquidation value.
The rather expensive-low borderline will be PER X PBR < 22.5
Note: A bad PER less than 15 is a necessary condition.
Good example: PER 13 and PBR 1.5 Bad example: PER 20 and PBR 0.8
3 Confirm financial statement
The principal financial statements are
1. Income statement(Profit and loss statement)
2. Balance sheet
3. Cash flow statement
3-1 income statement (profit and loss statement.)
An Income statement explains business results of the company (income and expenses) from the beginning of the fiscal year to year end.
First of all, closer look at net sales and net profit of past 3years.
A growing trend is best but stable is also good enough.
Pay attention if there are red figures in profit.
3-2 Balance sheet
Balance sheet explains financial conditions of the company as of yearend.
First of all, closer look at equity ratio.
It is a very important figure, as it shows the ratio of money that doesn’t have to returned.
Equity ratio is the figure that you get when you divide net assets by total assets.
Equity ratio = ( net assets) ÷ ( total assets) × 100%
In general, a guideline figure of equity ratio is about 40% and ideally around 60%-70% but it depends on the industry.
Please refer to the following standard figures.
The standard figure of equity ratio
|
Manufacturing industry |
45%~60% |
|
Trading industry |
40%~45% |
|
Retail industry |
45% |
|
Real estate industry |
35% |
|
Banking industry |
9% |
|
Securities industry |
36% |
|
Transportation(Railway/Shipping/Airlines) industry |
25%~30% |
|
Food service industry |
15%~30% |
3-3 Cash flow statement
Cash flow is the inflow and outflow of cash and there are three sections in a cash flow statement.
A. Cash flow from operating activities
B. Cash flow from investing activities
C. Cash flow from financing activities
A. Cash flow from operating activities shows how much cash flow a company earned or lost through ordinary operating activities.
Keeping cash flow from operating activities positive is very important.
The point of management is to earn as much as possible from cash flow from operating activities.
B. Cash flow from investing activities shows the movement of the money used by a company for investment. The point of investment money is spending money on future investment. This is due to the equipment becoming older and older so the company at least makes up for the reduced value in order to maintain its current activities.
Keeping cash flow from investing activities negative is also important.
C. Cash flow from financing activities shows the movement of money used in the financing activities of a company such as loans, corporate bonds. Or money a company returns to shareholders as dividends and purchase of their own stocks.
It is better that cash flow from financing activities is negative because it means that the company has paid money as returns to shareholders and loan repayments.
In short, the ideal form of cash flow management is to earn money through cash flow from operating activities and get free cash flow, and to spend the money on future investments, financial improvements and returns to the shareholders.

4 Company resume and Business content
Reference materials: The company’s website, Wikipedia, etc.
Examine an outline of the company for predicting if the business looks promising or not.
Ask yourself if the company will be necessary in five or ten years.
Imagine that the company is doing well and good for the three parties or not.
Good for the three parties (good for the seller, good for the buyer, and good for the world) is Omi merchant's motto.
The secret of business succeeds a long period.
The Omi merchant is one of Japans three largest merchants during the Edo period (1603-1868)

Good for the seller
Good for the buyer
Good for the world
The main reference stuff is business policy of the company, the interview of the president and so on.
This passage has gotten a bit long, but if you're reasonably familiar with the process, I believe it only takes about 3 to 5 minutes per stock to check the above information in the Shikiho or on Yahoo! Finance.
For those who have never read financial statements, it may feel a bit intimidating at first, but it really doesn’t require advanced financial knowledge or any complex analysis.
As you can see, it’s more of a routine, almost clerical task of confirming whether a stock is worth investing in, rather than something that demands much brainpower.
After that, all that remains is to buy the stock and simply “wait for fortune to smile upon you” — though, ironically, that may turn out to be the hardest part.