Today I will talk about Ube Industries, which is a conglomerate with its main business of chemical products followed by construction materials and machinery.


※The above images are from Ube Industries website
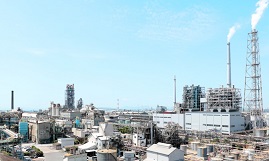
Ube Industries founded in 1897, has a core factory in Ube City, Yamaguchi Prefecture, and manufactures and sells not only in Japan, but also in many parts of the world such as Spain, Thailand, and the United States.
It’s focus is on three businesses consisting of chemicals, construction materials, and machinery.
Chemical business
The manufacturing and sale of a wide variety of chemical products such as nylon resin, which is a raw material for food packaging films and automobile parts, and then polyethylene, which is a general-purpose plastic, and advanced materials.
It also engages in the pharmaceutical field consisting of drug discovery.
Construction materials business
The manufacturing and sale of construction materials such as cement that is indispensable for construction work or infrastructure such as roads.
It also operates a private power plant that uses mega solar power and sells it to electric power companies.
Machinery business
The manufacturing and sale of injection molding machines used for manufacturing plastic parts, die casting machines, transport equipment, crushing equipment, etc.
¥1,764 (11/2 last closing price) The latest stock price← click here Trading unit: 100
The final month of the settlement: March
Dividend yield 5.10 % PER 13.72 PBR 0.54
Equity ratio 45.9 %
In the first half of the year (April-September), demand for automobiles and clothing fell and sales of chemicals used as raw materials were sluggish, so the full-year forecast has been revised downward.
Transition of business results
|
|
Net sales |
Operating profit |
Net profit |
Net profit per share |
dividend |
Dividend payout ratio |
|
2018.3 |
695,574 |
50,250 |
31,380 |
301.7 |
75 |
25% |
|
2019.3 |
730,157 |
44,551 |
32,499 |
312.4 |
80 |
26% |
|
2020.3 |
667,892 |
34,033 |
22,976 |
227.3 |
90 |
40% |
|
2021.3 |
592,000 |
21,500 |
13,000 |
128.5 |
90 |
70% |
※Unit of sales, operating profit, net income is one-million yen
※The figure for March 2021 is the predicted value
|
Cash flow statement |
2020.3 |
2019.3 |
|
CF operating activities |
684 |
504 |
|
CF investing activities |
▲406 |
▲426 |
|
CF financing activities |
▲189 |
▲240 |
※One unit is one hundred million yen
Note: You should be responsible for your own investment. Please make your own final judgment.