Today I will talk about Hakudo, a trading company specialized in industrial metal materials.
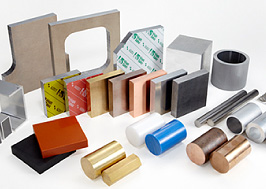

※The above images are from Hakudo’s website
Since its foundation in 1932, Hakudo trading has specialized in industrial metal
materials and handles various materials such as non-ferrous metals, steel, and plastic materials.
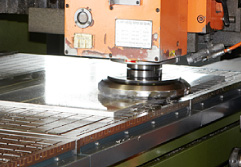
It always stocks about 4,400 items such as aluminum, copper, stainless steel, special steel, plastic, etc. at 5 factories in Japan. Its strength is the speed of cutting and processing to
customer’s’ desired size and shape in small lots with quick delively.
The main customers are for semiconductor and liquid crystal manufacturing equipment.,
In addition, Hakudo is increasing the number of items sold in the aerospace business,
which is expected to grow in demand around the world, so there is expected growth if it can expand market share.
Some tend to see Hakudo as an old fashioned company that still trades industrial metal material since it was founded in 1932, but it’s actively working to improve such as introducing a processing
robot and managing all processes through bar code.
In addition, Hakudo has taken initiative in the industry to introduce the latest and largest metal 3D printers and respond to requests for trial products.
¥1,323(5/15 last closing price) The latest stock price← click here Trading unit: 100
The final month of the settlement: March Dividend yield 4.38% PER 9.21 PBR 0.89
Equity ratio 50.6%
Hakudo is developing business overseas mainly in Asia, such as China, Vietnam, and Thailand.
In Japan, it is Increasing sales through strengthening its sales structure by improving convenience, such as responding to estimates and orders around the clock, 365 days a year, through Internet services.
Transition of business results
|
|
Net sales |
Operating profit |
Net profit |
Net profit per share |
dividend |
Dividend payout ratio |
|
2017.3 |
34,626 |
1,985 |
1,405 |
123.9 |
58.5 |
47% |
|
2018.3 |
43,709 |
2,784 |
2,028 |
178.8 |
75 |
42% |
|
2019.3 |
45,228 |
2,249 |
1,564 |
138.0 |
77 |
56% |
|
2020.3 |
45,400 |
2,330 |
1,630 |
143.7 |
58 |
40% |
※Unit of sales, operating profit, net income is one-million yen
※The figure for March 2020 is the predicted value
|
Cash flow statement |
2019.3 |
2018.3 |
|
CF operating activities |
2,073 |
3,103 |
|
CF investing activities |
▲1,027 |
▲1,379 |
|
CF financing activities |
▲850 |
▲663 |
※One unit is one hundred million yen
Note: You should be responsible for your own investment. Please make your own final judgment.